函数
组件绘制的一切都来自不含 Vue 的纯函数。它们可以把图写成 SVG 文件、精确读取结果、提前准备数据,也可以用来构建你自己的插图。按名称导入能让打包结果保持精简:只导入 modelFromSolver 的页面完全不会包含组件代码。
除非注明单位,所有数值均采用国际单位制;沿杆件的位置是距杆件起始节点的距离,单位为 m。
独立的 SVG 文件
页面中的图从页面的 CSS 自定义属性中取色,所以从中复制出来的 <svg> 没有颜色。structureSvg 则把图写成一个独立 .svg 文件的文本:颜色固定,没有样式表,没有脚本,布局与 StructurePlot 使用同一套程序。Word、PowerPoint、Inkscape、CairoSVG 和 LaTeX 工具链画出的效果与页面上相同。
import { writeFileSync } from 'node:fs'
import { modelFromSolver, structureSvg } from '@edubeam/plot'
import { portalFrame } from './frame.ts' // () => 已求解的 LinearStaticSolver,见“幻灯片与讲义”页面

const frame = modelFromSolver(portalFrame())
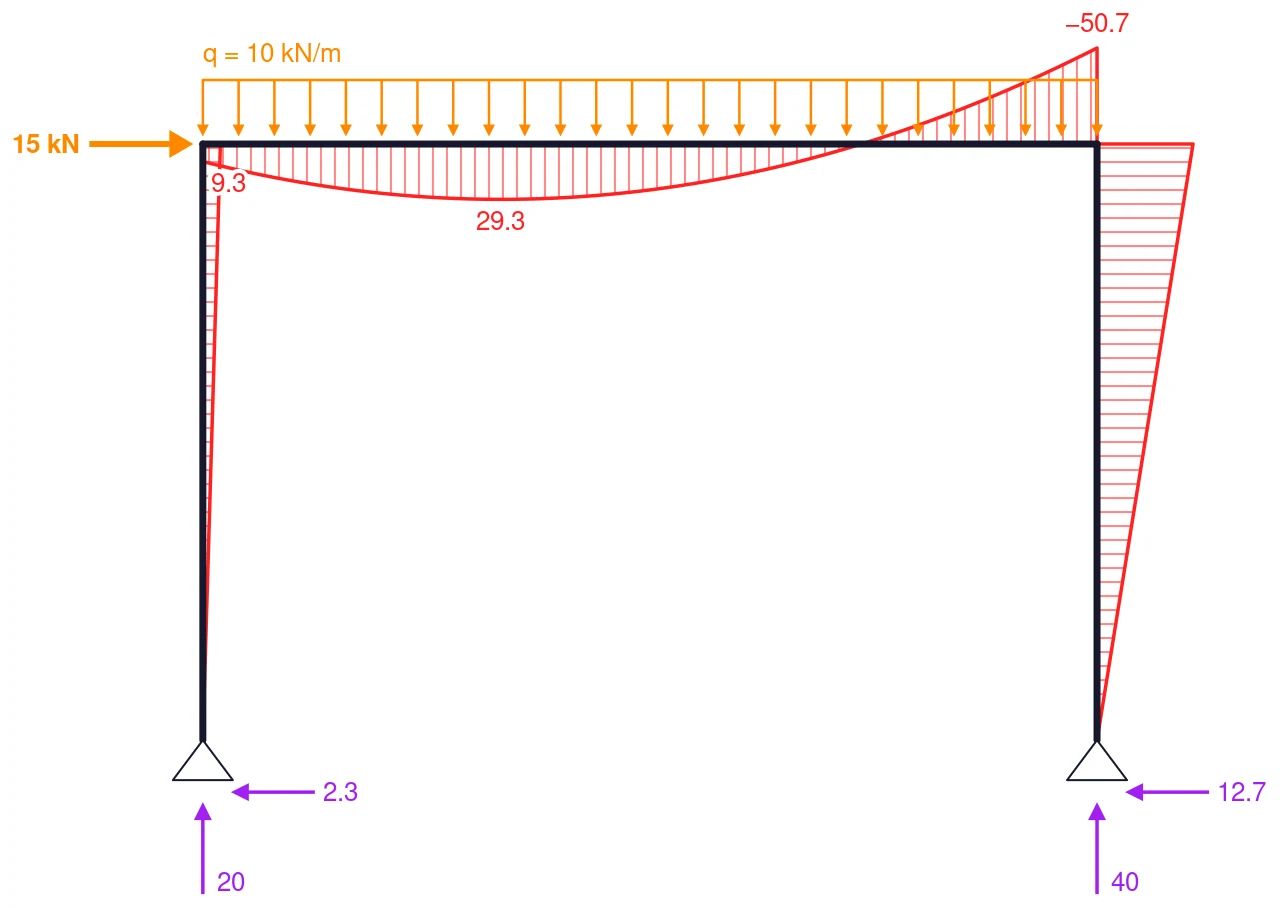
writeFileSync('frame.svg', structureSvg(frame, { layers: ['members', 'supports', 'loads', 'reactions', 'M'] }))
| 选项 | 默认值 | 作用 |
|---|---|---|
layers | members, supports, loads, reactions and the result StructurePlot would pick | 要绘制的内容 |
width | 640 | 宽度,px,即 SVG 的用户单位 |
height | follows the drawing | 固定高度,px |
maxHeight | max(320, 0.75 × width) | 自动高度的上限 |
padding | 6 | 图周围的留白,px |
fontSize | 13, compact 11.5 | 文字大小,px |
fontFamily | Helvetica, Arial, sans-serif | 打开文件的程序中可用的字体列表 |
colors | PRINT_COLORS | 覆盖任一色调,写成具体的颜色值 |
background | true | 用 paper 颜色填充背景;false 时背景透明 |
title | none | 写作 SVG 的 <title> |
reserve, reserveLabelModes, reserveReactionLabels | none | 除所绘内容外还要预留位置的图层、标注方式和支反力标注方式,使逐步呈现的各个文件彼此对齐:见在 Beamer 中逐步呈现 |
units, numberFormat, compact, diagramSize, deformedSize, momentOnTensionSide, resultLabelMode, reactionLabels | as StructurePlot | 含义与组件的同名属性相同 |
PRINT_COLORS 是 EduBeam 应用在白底上的配色:墨色 #16182b,轴力 #2222ff,剪力 #00af00,弯矩 #ff2222,荷载 #ff8700,支反力 #a020f0。每个标注都写两遍,文字下面垫一层背景色的衬底,因为并不是所有 SVG 程序都支持 paint-order;下标(如支反力名称 Ax 中的下标)是一个只含普通数值的 tspan,Word 和 Inkscape 都能读取。不设 reserve 时,文件按所画的图层确定大小。
文件的用法:
- Word 和 PowerPoint(2019 和 Microsoft 365):插入 › 图片。
- LaTeX:用 CairoSVG(
cairosvg frame.svg -o frame.pdf)或 Inkscape 转换为 PDF,再用\includegraphics插入;或者使用svg宏包的\includesvg,它会替你调用 Inkscape。宽 640 个单位的图放在 16 cm 宽的版心中,标注为 9 pt。 - 不使用 Vue 的网页:把文本粘贴到 HTML 中。见不使用 Vue。
习题与测验为每名学生的题目和参考答案各写出一个文件。
从求解器读取
| 导出 | 签名 | 作用 |
|---|---|---|
modelFromSolver | (solver: Solver, options?: FromSolverOptions) => PlotModel | 把求解器读成纯数据的绘图模型;只有已求解的荷载工况才包含结果 |
FromSolverOptions | type | { loadCase?: number },solver.loadCases 中的索引 |
分段多项式
杆件的结果是 Piecewise 值:由 { x0, x1, c } 分段组成的列表,说明见绘图模型。side 用于在两段相接处选取左侧('left')或右侧('right',默认)的值。
| 导出 | 签名 | 作用 |
|---|---|---|
valueAt | (pw, x, side?) => number | x 处的值;超出两端时取最近端点的值 |
slopeAt | (pw, x, side?) => number | 导数,单位为原数值的单位/m |
extremes | (pw) => { max: Extreme; min: Extreme } | null | 精确的最大值和最小值,每个都是 { x, value, side } |
maxAbs | (pw) => number | 最大绝对值 |
innerBreaks | (pw) => number[] | 各段相接处,不含两端 |
isZero | (pw) => boolean | 结果是否处处为零 |
evalPiece | (piece, x) => number | 单个分段的值 |
evalPieceSlope | (piece, x) => number | 单个分段的斜率 |
pieceExtrema | (piece) => number[] | 分段斜率为零的位置,m |
pieceDegree | (piece) => number | null | 分段的次数;为零时返回 null |
cleanPiecewise | (pw, tolerance) => Piecewise | 去掉小于 tolerance 的系数,即求解结果中的舍入误差 |
fitPiece | (f, x0, x1, degree) => Piece | 在 (x0, x1) 上拟合函数的指定次数多项式 |
pieceToBeziers | (piece, segments?) => CubicSegment[] | 把分段表示为 (x, 数值) 坐标中的三次 Bézier 曲线:三次及以下精确,更高次时用 segments 段近似,默认 4 段 |
类型:Piece、Piecewise、Side('left' \| 'right')、Extreme、CubicSegment。
单位与数字
| 导出 | 签名 | 作用 |
|---|---|---|
KN_UNITS | Units | kN、kNm、kN/m、m、mm、mrad、K:默认单位 |
SI_UNITS | Units | N、N·m、N/m、m、m、rad、K |
resolveUnits | (units?: Partial<Units>) => Units | 合并了你的覆盖设置的 KN_UNITS |
DEFAULT_NUMBER_FORMAT | Intl.NumberFormat | 英文格式,最多一位小数 |
formatNumber | (value, format?) => string | 带真正负号的数字,绝不出现 −0 |
formatQuantity | (si, unit, format?) => string | "36 kN":把国际单位制数值换算到某一单位,数值与单位之间用窄不换行空格 |
Unit 为 { symbol, scale },显示值 = 国际单位制数值 × scale。Units 为每种 UnitKind 各含一个单位:force、moment、distributed、length、displacement、rotation 和 temperature。
import { formatQuantity, KN_UNITS } from '@edubeam/plot'

formatQuantity(-37500, KN_UNITS.moment) // "−37.5 kNm"
读取数值
| 导出 | 签名 | 作用 |
|---|---|---|
readMember | (results: MemberResults, x, snap?) => { x, u, values } | x 处的 N、V、M 和 w(各为 { left, right })以及轴向位移 u;在 snap m 范围内吸附到突变处 |
readoutAt | (model, transform, px, py, reach) => Readout | null | 距屏幕上某点 reach px 范围内最近的杆件及该处的结果 |
readoutMarks | (model, transform, readout, shown, k, side) => ReadoutMark[] | 读数的标记位置:每幅显示中的内力图的纵坐标顶端(突变处两侧各一个),以及变形图上的点 |
formatReadout | (readout, quantity, units, format?) => string | "M = 54 kNm",突变处为 "V = 13.3 → −6.7 kN" |
k 是每种结果每个国际单位对应的像素数,side 是每幅内力图绘制在哪一侧,分别来自下文的 diagramScales 和 diagramSide。类型:Readout、ReadoutMark({ tone, from, to },px)、ReadoutQuantity('N' \| 'V' \| 'M' \| 'w')、SidedValue。
梁轴线
这些是 DiagramStack 的组成部分,可用来构建你自己的上下对齐的内力图。
| 导出 | 签名 | 作用 |
|---|---|---|
beamLine | (model, ids?) => BeamLine | 把杆件组成一条从左到右的水平直线;其他情况抛出异常 |
lineDiagram | (model, line, row) => Piecewise | 沿整条直线的某一结果,以直线的 x 坐标表示 |
rowRange | (pw) => [number, number] | 某一行缩放所依据的范围,总是包含零 |
rowPeaks | (pw) => RowPeak[] | 某一行上值得标出的极值 |
rowBreaks | (pw) => number[] | 结果分段的位置:支座、杆件连接处和集中荷载处 |
rowOutline | (pw, sx, sy, close) => string | 某一行轮廓的 SVG 路径数据,需给定从 m 和数值到 px 的映射 |
rowOrdinates | (pw, sx, sy, spacing) => string | 阴影线纵坐标的 SVG 路径数据,间距为 spacing px |
lineModel | (model, line, omit?) => PlotModel | 只保留该直线部分的模型,可以去掉其中一个荷载 |
pointLoadAt | (model, line, at) => PlotLoad | undefined | 直线上位置 at 处的集中力 |
类型:BeamLine、LineMember、RowPeak、StackRow。
DiagramStack 页面用 beamLine、lineDiagram 和 rowRange 让每一行的比例在移动荷载的所有位置下保持不变。
几何与支座
| 导出 | 签名 | 作用 |
|---|---|---|
nodeMap | (model) => ReadonlyMap<string, PlotNode> | 按 id 索引的节点 |
memberFrame | (model, member, nodes?) => MemberFrame | 杆件的起点、单位切向量、局部 z 轴单位向量和长度 |
memberFrames | (model) => Map<string, MemberFrame> | 所有杆件的上述数据,按 id 索引 |
pointAlong | (frame, at) => { x, z } | 沿杆件 at m 处的点 |
supportKind | (fixity) => SupportKind | 'fixed'、'pin'、'roller'、'slider'、'rotation' 或 'none' |
supportPlacement | (model, node) => SupportPlacement | 节点的支座符号及其顺时针转角,度 |
supportGlyph | (kind) => readonly GlyphPart[] | 支座符号的线条,px |
glyphReach | (kind, rotation, x, z) => number | 旋转后的符号沿某一方向伸出的距离,px |
绘图
绘图分三步。buildStructureScene 把模型转成场景元素:模型中的点加上以屏幕像素计的偏移。fitScene 求出使它们恰好放进一个框的比例和偏移。resolveScene 把它们转成 SVG 路径数据、圆,以及有空间放置的标注。layoutStructure 像 StructurePlot 和 structureSvg 那样依次执行这三步,所以你自己的插图会以同样的方式布局。
| 导出 | 签名 | 作用 |
|---|---|---|
layoutStructure | (model, options, box, shown?, labelModes?) => StructureLayout | 完整布局:带全部标注适配,去掉拥挤的标注,再适配一次。返回 { fit, items, resolved } |
structureSvg | (model, options?) => string | 独立的 .svg 文件:见上文 |
buildStructureScene | (model, options: StructureSceneOptions) => SceneItem[] | 按给定比例(每米对应的像素数)绘制所选图层 |
fitScene | (items, box: FitBox) => Fit | 放进框 { width, height?, maxHeight?, padding, fontSize } 的比例和偏移 |
resolveScene | (items, transform, options: ResolveOptions) => ResolvedScene | 以 px 表示的 { paths, circles, texts },只含放得下的标注 |
placeLabels | (items, transform, options: ResolveOptions) => Map<SceneText, SceneText> | 保留哪些标注,放在哪里 |
alternativeResultGroups | (shown) => ReadonlySet<string> | 每次只显示其中一个的结果图层:它们的标注给其他内容让位,但彼此之间不让位 |
sceneBounds | (items, scale, fontSize) => Bounds | 场景的范围,px |
project | (transform, anchor) => [number, number] | 场景中的点在屏幕上的位置,px |
defaultResultLayer | (model) => ResultLayer | null | 未指定时图所显示的结果 |
diagramScales | (model, options) => Record<ResultLayer, number> | 每种结果每个国际单位对应的像素数 |
diagramSide | (q, momentOnTensionSide) => 1 | -1 | 正值画在杆件的哪一侧 |
isBarStructure | (model, memberResults) => boolean | N 是否沿杆写成数字(桁架),而不是画成内力图 |
tipPlacements | (tip, out, mode, gaps?) => TextPlacement[] | 数值在纵坐标顶端之外可放置的位置 |
PLOT_LAYERS | readonly PlotLayer[] | 所有图层,按绘制顺序排列 |
RESULT_LAYERS | ['N', 'V', 'M', 'w'] | 结果图层 |
HATCH_SPACING_PX | 7 | 内力图纵坐标线的间距,px |
DEFAULT_COLORS | PlotColors | 每种色调的默认颜色,CSS 写法:主题与颜色 |
PRINT_COLORS | Record<Tone | 'paper', string> | 文件用的固定颜色,即应用在白底上的配色 |
toneVars | (colors?) => Record<string, string> | 图在根元素上设置的自定义属性 |
PLOT_CSS | string | 内联到每幅图中的 CSS 规则 |
ResolveOptions 为 { fontSize, viewport?, exclude?, alternativeGroups?, shields? }:shields 是其线条会挡开标注的组(正在显示的内力图),省略时为全部组。在 layoutStructure 中,options.layers 是要布局的图层(所有可能显示的图层,与 reserve 类似),shown 是正在显示的图层,labelModes 是要预留位置的标注方式。
类型:StructureSceneOptions、StructureLayout、StructureSvgOptions、SceneItem、SceneText、TextPlacement、ResolvedScene、ResolvedPath、ResolvedText、ResolvedCircle、ResolveOptions、Bounds、Anchor、Transform、Fit、FitBox、Tone、PlotLayer、ResultLayer、ResultLabelMode、ReactionLabels、SupportKind、SupportPlacement、GlyphPart,以及绘图模型中的模型类型。