StructurePlot
StructurePlot draws a whole structure, fitted to the width of its box: members, hinges, supports, loads, reactions, the N, V and M diagrams and the deformed shape. Give it a solver, or the plain model made from one, and say what to draw.
<StructurePlot :solver="solver" :layers="['members', 'supports', 'loads', 'reactions', 'M']" />
Every prop, with its type and default, is in the Component API.
This figure is a StructurePlot with nodeLabels and dimensions on, hover set, and this site's number format of four significant digits: switch between the results, and point at a member to read its values.
Layers
A plot is made of layers, painted in a fixed order whatever order you list them in:
| Layer | Draws |
|---|---|
members | the members, with hinges as small circles |
supports | a symbol for every support, turned for inclined ones |
loads | nodal and member loads, temperature and settlements, with their values |
reactions | the reactions, as arrows and curved arrows with their values; or, with reactionLabels: 'names', as the named unknowns of an exercise |
nodes | every node as a small circle |
nodeLabels | the node labels |
dimensions | chain dimensions, as an exercise sheet gives them: every span between nodes and point loads below the structure, every storey to its right, and the overall size on a second line |
N, V, M | the normal force, shear force and bending moment diagrams |
w | the deformed shape |
Leave layers out and the plot draws members, supports, loads and reactions, plus one result chosen for the structure: M for beams and frames, N for a truss, and w when nothing carries a force, as in a beam free to expand under a temperature load.
The diagrams follow the EduBeam app: N and V are hatched across the member, and M hangs on the tension side, so a sagging moment is below a beam. :moment-on-tension-side="false" draws M on the compression side instead. A truss shows each bar's force once, along the bar, coloured by sign.
Figures that build up
reserve lists layers to make room for while they are hidden. The plot lays out every reserved layer from the start, so when one is switched on it fades in where it belongs and nothing else moves:
<script setup lang="ts">
import type { PlotLayer } from '@edubeam/plot'

const stages: PlotLayer[][] = [
  ['nodes', 'nodeLabels', 'dimensions'],
  ['nodeLabels', 'members', 'supports'],
  ['nodeLabels', 'members', 'supports', 'loads'],
  ['members', 'supports', 'loads', 'reactions'],
  ['members', 'supports', 'reactions', 'M'],
]
const all = [...new Set(stages.flat())]
// `frame` is a solved solver and `step` the current stage: Slides and notes has the whole component
</script>

<template>
  <StructurePlot :solver="frame" :layers="stages[step]" :reserve="all" />
</template>
With animate, on by default, layers fade in and members draw themselves from end to end. Under prefers-reduced-motion nothing animates. Slides and notes puts this figure in a slide deck.
Diagram values
Each value is written just beyond the tip of the ordinate it belongs to, as a textbook labels a diagram: every non-zero member end, the extremes in between, both values at a step, and a rigid corner once. Values are bare numbers in the display unit (kN for N and V, kNm for M), and so are the reactions, as in the EduBeam app; units are written only with what is given: loads, settlements and temperature changes. A label that would overlap another label, a member or an arrow tries other places at the same tip, and is left out if none is free, so two numbers never sit on top of each other. The values of loads and reactions are placed first, so a diagram's numbers never push them out. Truss bar forces are never left out: they slide along the bar, flip sides and, as a last resort, shrink.
result-label-mode="axis" turns the values to run along their ordinates, as the EduBeam app writes them. If the reader can switch between the two, give :reserve-label-modes="['horizontal', 'axis']" so the drawing does not move when they do.
Reactions as unknowns
An exercise sheet asks for the reactions, so it should show them without their values. reaction-labels="names" draws an arrow for every direction a support holds, pointing the way it counts as positive: along the node's x (to the right unless the support is turned), upwards, and counter-clockwise for a fixing moment. Each is named after its node, Ax, Az, MA, in italics with a real subscript. The sign of every answer is then defined on the drawing: a reaction that acts the other way is negative.
<StructurePlot
  :model="model"
  :layers="['members', 'supports', 'loads', 'reactions', 'nodeLabels', 'dimensions']"
  reaction-labels="names"
/>
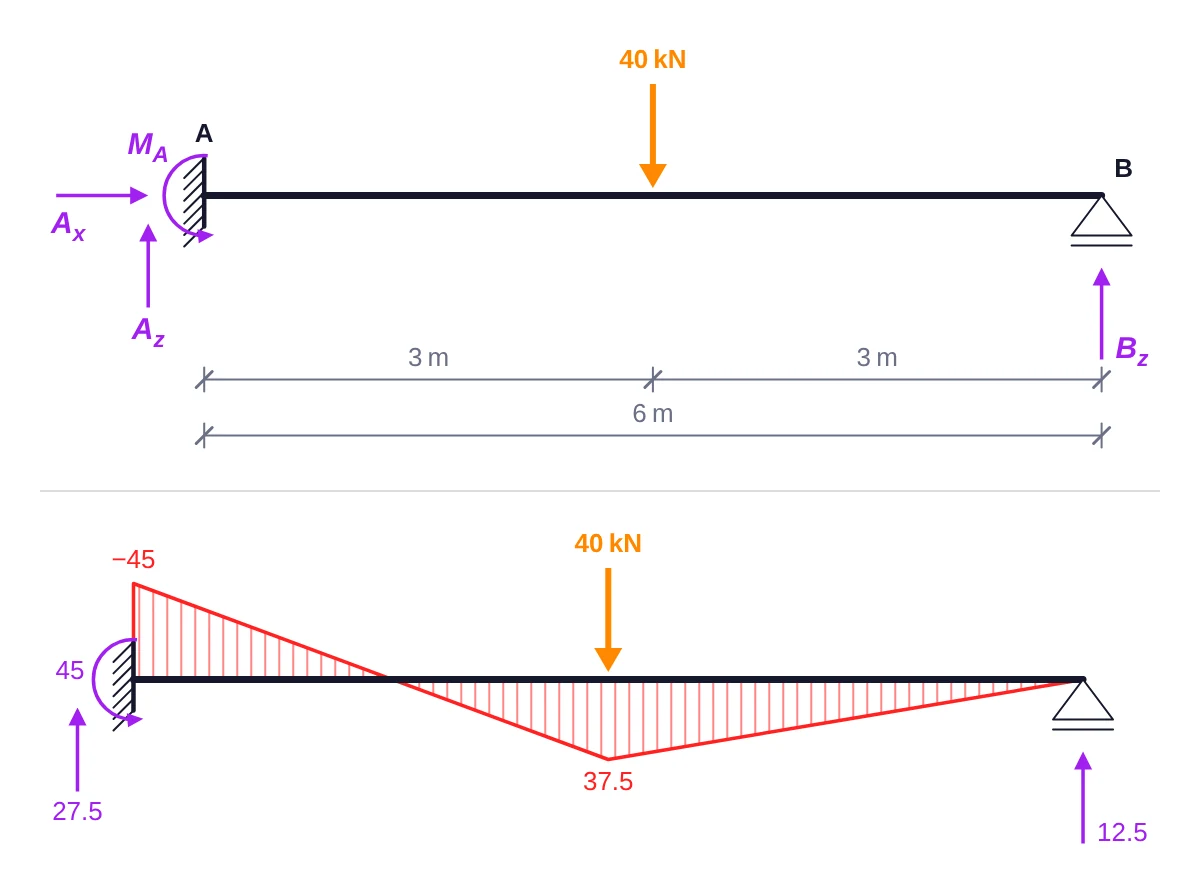
Names need no results, so a model that has not been solved can be drawn as a sheet. Leave reactionLabels at 'values' for the key. The names and the values take different room (a horizontal reaction of zero has a name on the sheet but no arrow in the key), so a plot that switches between them should make room for both with :reserve-reaction-labels="['names', 'values']": the drawing then stays where it is and only the labels change. The exercise card in Exercises and tests switches between them with an answers prop, as this site's practice problems do when the student asks for the solution.
Thumbnails
compact draws for tiles of about 400 × 200 px: smaller symbols and 11.5 px text, at most two values per member, and line loads labelled by their magnitude alone, without q =.
<StructurePlot v-for="t in tiles" :key="t.title" :solver="t.solver" compact :height="200" :title="t.title" />
The examples gallery of this site is drawn this way.
Size
The plot measures its box and lays out at that width, in real pixels. Without height its height follows the drawing, up to maxHeight, by default . Before it can measure, on the server for instance, it uses width, 640 px by default.
| Prop | Default | Sets |
|---|---|---|
width | 640, compact 400 | the layout width until the box is measured, px |
height | follows the drawing | a fixed height, px |
maxHeight | , compact none | the upper bound of the automatic height |
padding | 6 | space around the drawing, px |
fontSize | 13, compact 11.5 | text size, px |
diagramSize | 48, compact 26 | the length of the largest ordinate, px |
deformedSize | 30, compact 18 | the largest displacement of the deformed shape, px |
Several plots at one scale
Each plot scales its diagrams to its own largest value, so a 20 kNm moment looks as big as an 80 kNm one. To compare, fix the scale in pixels per SI unit with diagramScale:
<script setup lang="ts">
import { StructurePlot } from '@edubeam/plot'
import { simpleBeam } from './beams' // from Getting started: (span m, q kN/m) => a solved solver

const spans = [4, 6, 8].map((L) => ({ L, solver: simpleBeam(L, 10) }))
// 0.5 px per kNm (0.5e-3 px per N·m): the 80 kNm of the 8 m span is drawn 40 px deep, the 20 kNm of the 4 m span 10 px
const scale = { M: 0.5e-3 }
</script>

<template>
  <figure v-for="s in spans" :key="s.L">
    <StructurePlot :solver="s.solver" :layers="['members', 'supports', 'M']" :diagram-scale="scale" />
    <figcaption>L = {{ s.L }} m</figcaption>
  </figure>
</template>
Units and numbers
Values are SI inside and converted only for display: kN, kNm, kN/m, m, mm, mrad and K by default. Override any unit with a symbol and a scale, display value = SI value × scale:
<StructurePlot :solver="solver" :units="{ force: { symbol: 'N', scale: 1 } }" />
Numbers go through an Intl.NumberFormat, English with at most one decimal by default. Pass your own to match the page's language:
<StructurePlot :solver="solver" :number-format="new Intl.NumberFormat('cs', { maximumFractionDigits: 2 })" />
Minus signs are true minus signs (−), and a value that rounds to zero never shows as −0. The unit names are force, moment, distributed, length, displacement, rotation and temperature; KN_UNITS and SI_UNITS are exported as starting points.
Reading values
With hover, the plot reads the shown results at the member point under the pointer. It marks each value where it is drawn, with a dot at the tip of each shown diagram's ordinate (both tips across a step) or on the deformed shape, and lists them in a pill, such as M = 54 kNm, or both sides of a step, V = 13.3 → −6.7 kN. The pointer picks up a member from anywhere over its diagram, not only on the member. The plot also emits the values as data:
<script setup lang="ts">
import { ref } from 'vue'
import { StructurePlot, type Readout } from '@edubeam/plot'
import { portalFrame } from './frame' // from Slides and notes: () => a solved solver

const frame = portalFrame()
const reading = ref<Readout | null>(null)
</script>

<template>
  <StructurePlot :solver="frame" :layers="['members', 'supports', 'M']" hover @readout="reading = $event" />
  <p v-if="reading">
    Member {{ reading.member }}, {{ reading.x.toFixed(2) }} m from its start:
    M = {{ (reading.values.M.left / 1e3).toFixed(1) }} kNm
  </p>
</template>
A readout is { member, x, px, py, values, u }: the member, the position along it in metres, the point on screen in px, { left, right } for each of N, V, M and w in SI units, and the axial displacement u. It is null when the pointer leaves. The live figures on this site use hover: point at one.
Without hover, a plot attaches no event listeners at all, so the page scrolls over it and a tap on a plot inside a link follows the link. With it, the plot listens to pointer events only and keeps vertical scrolling and pinch-zoom working on touch screens.
Accessibility
Each plot is an <svg role="img"> named by its title prop, or by a description of what it shows, such as "Structure with its loads, reactions, bending moment". Hidden reserved layers are aria-hidden.