DiagramStack
DiagramStack draws the figure of every statics textbook: a straight beam with its supports, loads and reactions, and beneath it, on the same x axis, its shear force V(x), bending moment M(x) and deflection w(x). A cursor reads every row at once, and an optional point load can be dragged along the beam.
<DiagramStack :solver="solver" />
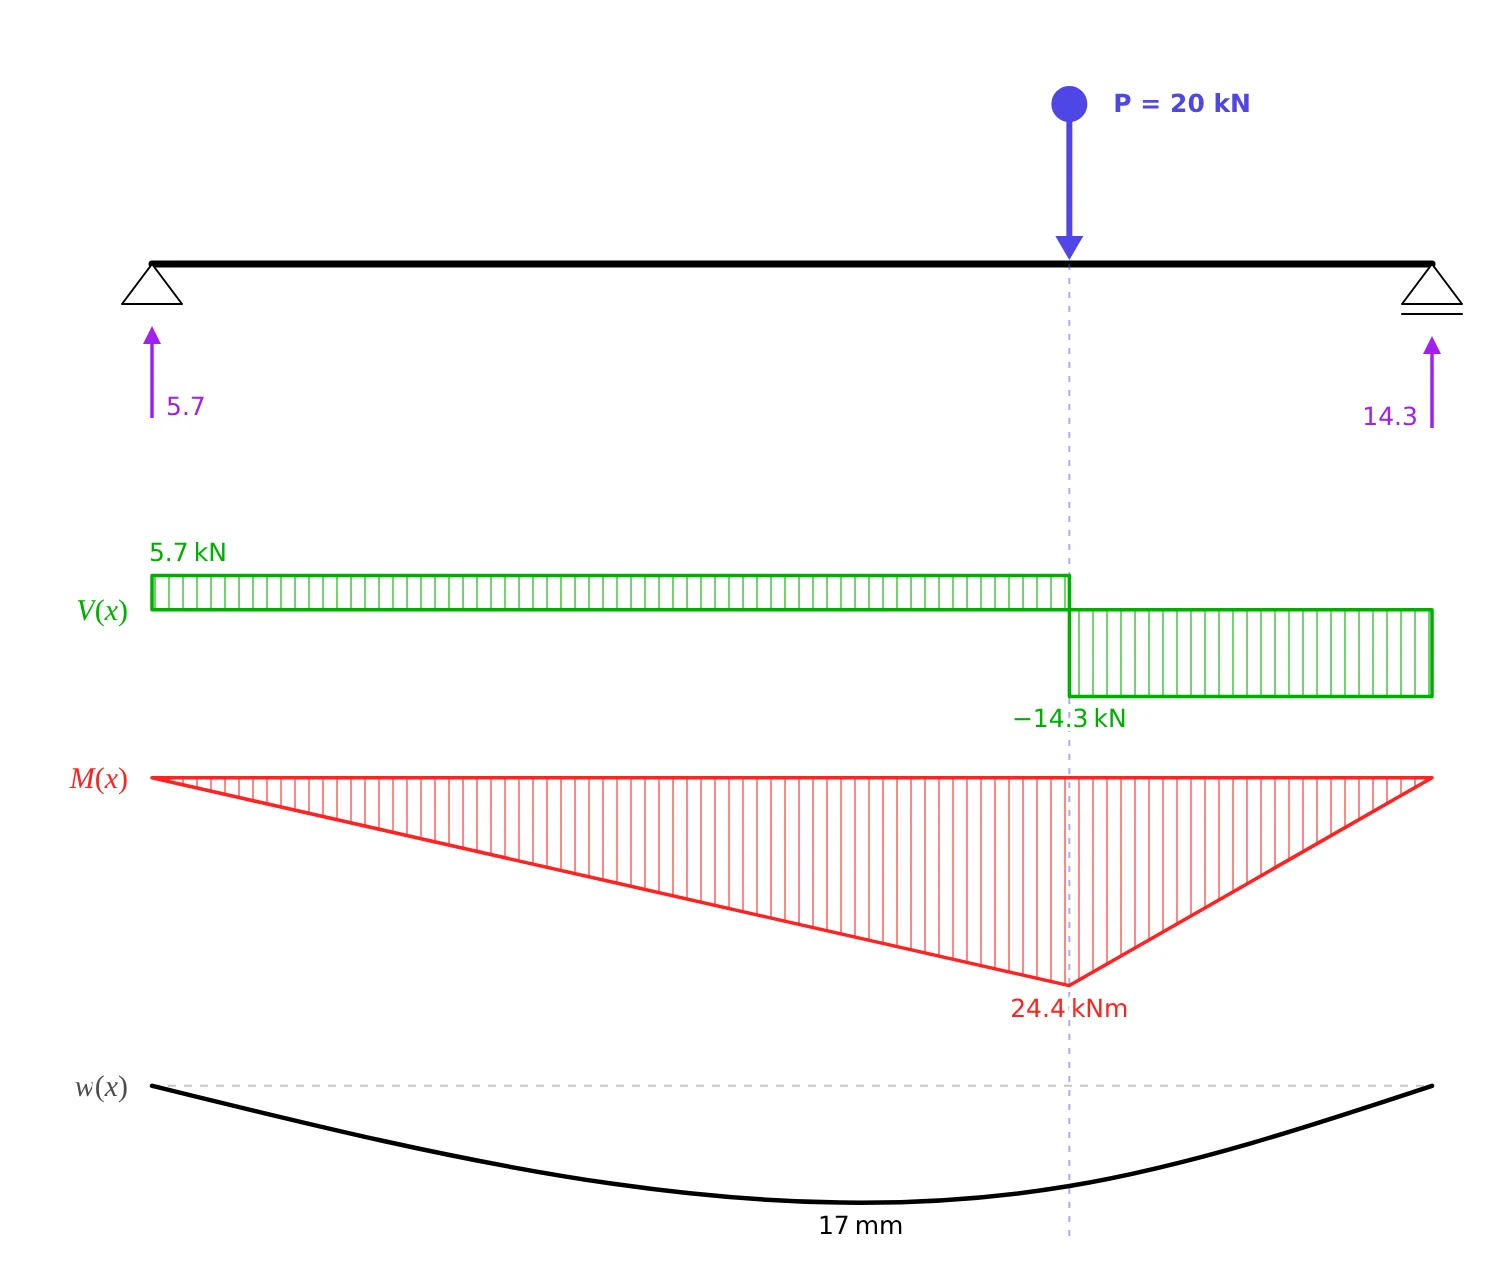
The members must form one horizontal line, drawn left to right. Anything else, an inclined or broken line or a member drawn right to left, is refused with an error rather than drawn wrongly, because the figure's x axis is the beam's. Every prop is in the Component API.
Rows
| Prop | Default | Sets |
|---|---|---|
rows | ['V', 'M', 'w'] | the diagrams, top to bottom; 'N' is available too |
loadRow | true | the beam with its supports, loads and reactions above the rows |
members | all members | the members of the beam line, when the model has others |
rowHeights | N 100, V 116, M 128, w 76 px | row heights; a little smaller below 560 px of width |
maxHeight | none | rows shrink, to 60 % at most, so the figure fits; text keeps its size |
ranges | each row's own | fixed value ranges per row, in SI units |
V and N are drawn positive upward, M and w positive downward, as most textbooks draw them: a sagging moment and a downward deflection hang below the axis. Each row writes its extreme values.
The reading cursor
hover is on by default. Moving the pointer over the figure shows a vertical cursor across every row, with each row's value in a pill. Within 8 px of a step, at a point load or a support, the cursor snaps to it, and V shows both sides, as in 5.7 → −14.3 kN under the load above. The values are also emitted:
<DiagramStack :solver="solver" @readout="(r) => (reading = r)" />
A readout is { x, values }: x in metres along the beam, and { left, right } per row in SI units; null when the pointer leaves.
A load the reader can drag
Give v-model:load-at the position of a point load and it gets a grip: the reader drags it with the pointer, or focuses it and uses the arrow keys. The component only reports the new position. Solve the beam again with the load there and pass the new solver back, as MovingLoad.vue does:
<script setup lang="ts">
import { computed, ref } from 'vue'
import { DofID, LinearStaticSolver } from '@edubeam/fem'
import { beamLine, DiagramStack, lineDiagram, modelFromSolver, rowRange, type StackRow } from '@edubeam/plot'

const L = 6 // m
const P = 20e3 // N

/** The beam with the point load `at` metres from A, solved. */
const solveWithLoadAt = (at: number): LinearStaticSolver => {
  const solver = new LinearStaticSolver()
  const { domain } = solver
  domain.createMaterial(1, { e: 210e9, g: 81e9 })
  domain.createCrossSection(1, { a: 28.5e-4, iy: 1943e-8, h: 0.2, k: 1e32 })
  domain.createNode('A', [0, 0, 0], [DofID.Dx, DofID.Dz])
  domain.createNode('B', [L, 0, 0], [DofID.Dz])
  domain.createBeam2D(1, ['A', 'B'], 1, 1)
  solver.loadCases[0].createBeamConcentratedLoad(1, [0, P, 0, at], true)
  solver.solve()
  return solver
}

/** Each row's range over every load position, so the diagrams grow and shrink instead of rescaling. */
const rows: StackRow[] = ['V', 'M', 'w']
const envelope = (() => {
  const ranges: Partial<Record<StackRow, [number, number]>> = {}
  for (let at = 0.25; at < L; at += 0.25) {
    const model = modelFromSolver(solveWithLoadAt(at))
    const line = beamLine(model)
    for (const row of rows) {
      const [lo, hi] = rowRange(lineDiagram(model, line, row))
      const [min, max] = ranges[row] ?? [0, 0]
      ranges[row] = [Math.min(min, lo), Math.max(max, hi)]
    }
  }
  return ranges
})()

const at = ref(2)
const solver = computed(() => solveWithLoadAt(at.value))
</script>

<template>
  <DiagramStack v-model:load-at="at" :solver="solver" :rows="rows" :ranges="envelope" load-label="P = 20 kN" />
  <p>The load is {{ at.toFixed(2) }} m from A.</p>
</template>
With the load at 4.3 m, the figure shows the reactions 5.7 kN and 14.3 kN, the shear step from 5.7 to −14.3 kN under the load, and kNm there. Without ranges, every row rescales to its own extremes as the load moves, and the diagrams would seem not to change at all.
| Prop | Default | Sets |
|---|---|---|
loadAt | none | the load's position, m from the start of the line; with v-model:load-at |
loadLabel | P = … | the text beside the grip |
loadStep | 0.05 | the drag rounds to this step, m; the arrow keys move by it |
The grip is a focusable role="slider" with its range and position for screen readers. The arrow keys move it by loadStep, Page Up and Page Down by 1 m, and Home and End to the ends of the beam. A finger can drag it on a touch screen, and vertical scrolling still works over the figure.
The grip stands in for the point force the solved model has at loadAt: that force is drawn as the grip, labelled with its magnitude unless you give loadLabel. Put the load in the model at the same position, as solveWithLoadAt does.
Size and server rendering
The figure measures its box and lays out at that width, at least 320 px. Before it can measure, it uses width, 720 px by default. Text is 12.5 px (fontSize) and never scales down with the figure.