Slides and lecture notes
Show a structure the way you explain it: first the geometry, then the supports and loads, then the reactions, and last the bending moment. A figure drawn from a solved model builds up in place, one layer per click, and is always right. The same model then gives the figures for your notes.
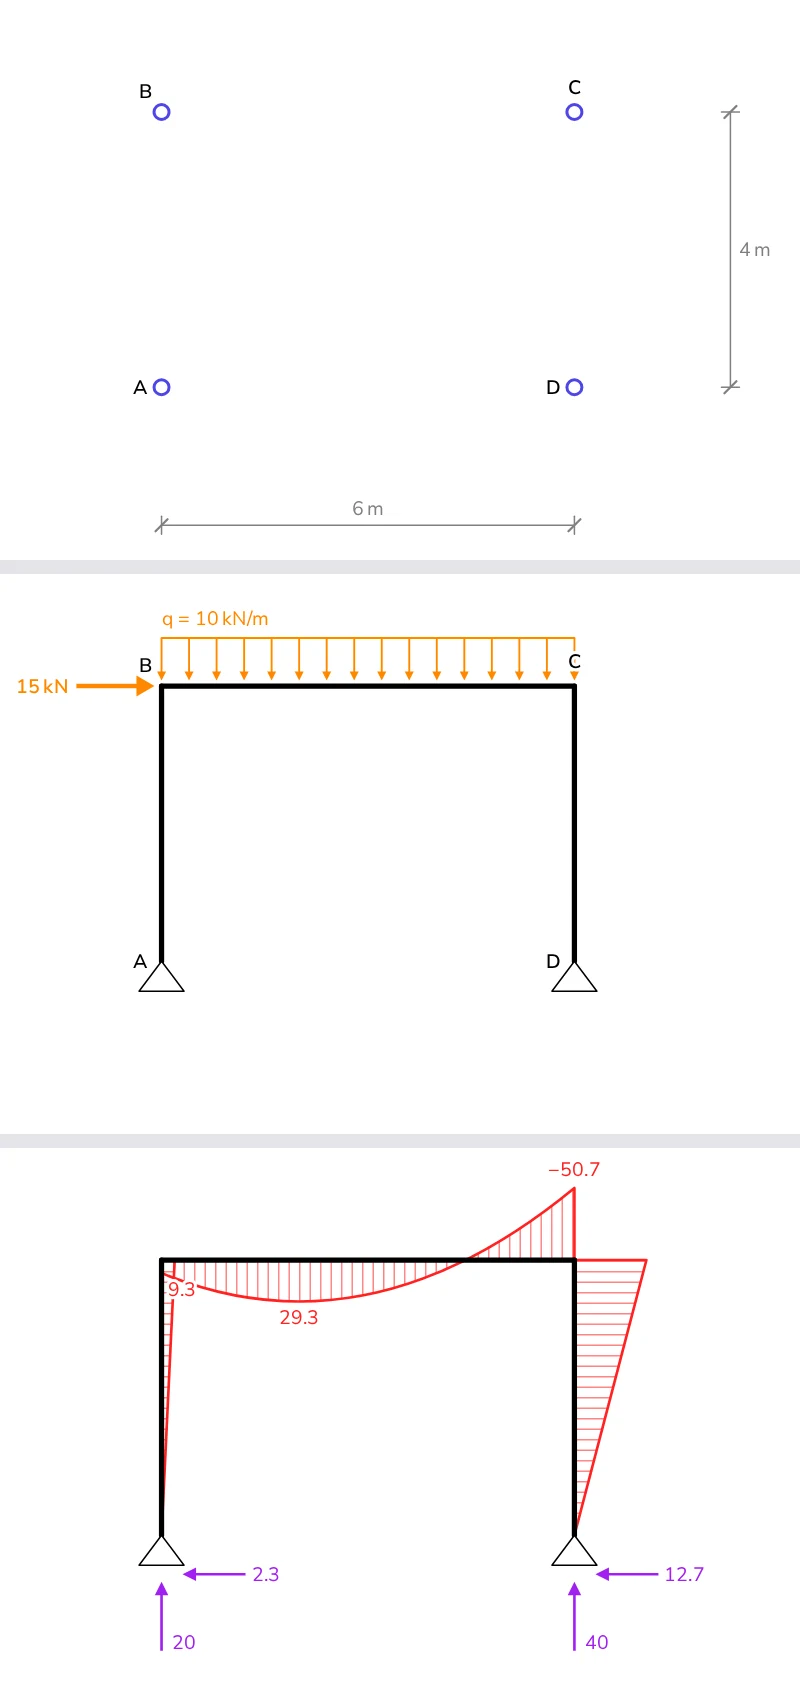
A figure that builds up
Two files. frame.ts builds and solves the structure:
import { DofID, LinearStaticSolver } from '@edubeam/fem'

/** A portal frame: 6 m by 4 m, pinned feet, 10 kN/m on the beam and 15 kN pushing at B. */
export const portalFrame = (): LinearStaticSolver => {
  const solver = new LinearStaticSolver()
  const { domain } = solver
  domain.createMaterial(1, { e: 210e9, g: 81e9 })
  domain.createCrossSection(1, { a: 53.8e-4, iy: 8356e-8, h: 0.3, k: 1e32 }) // IPE 300
  domain.createNode('A', [0, 0, 0], [DofID.Dx, DofID.Dz])
  domain.createNode('B', [0, 0, -4]) // z points down: 4 m up
  domain.createNode('C', [6, 0, -4])
  domain.createNode('D', [6, 0, 0], [DofID.Dx, DofID.Dz])
  domain.createBeam2D(1, ['A', 'B'], 1, 1)
  domain.createBeam2D(2, ['B', 'C'], 1, 1)
  domain.createBeam2D(3, ['C', 'D'], 1, 1)
  solver.loadCases[0].createBeamElementUniformEdgeLoad(2, [0, 10e3], true)
  solver.loadCases[0].createNodalLoad('B', { [DofID.Dx]: 15e3 })
  solver.solve()
  return solver
}
BuildUp.vue draws it in stages. Each stage lists the layers it shows, and reserve lays out all of them from the first click, so each layer fades in where it belongs and nothing moves:
<script setup lang="ts">
import { computed } from 'vue'
import { StructurePlot, type PlotLayer } from '@edubeam/plot'
import { portalFrame } from './frame'

const props = defineProps<{ step: number }>()

const stages: PlotLayer[][] = [
  ['nodes', 'nodeLabels', 'dimensions'], // the geometry
  ['nodeLabels', 'members', 'supports'], // the structure
  ['nodeLabels', 'members', 'supports', 'loads'], // its loads
  ['members', 'supports', 'loads', 'reactions'], // the reactions
  ['members', 'supports', 'reactions', 'M'], // and the bending moment
]
const all = [...new Set(stages.flat())] // laid out from the first step, so nothing moves later
const layers = computed(() => stages[Math.min(props.step, stages.length - 1)])

const frame = portalFrame()
</script>

<template>
  <StructurePlot :solver="frame" :layers="layers" :reserve="all" :height="360" />
</template>
A layer can leave as well: the last stage drops the loads to give the moment room. :height="360" keeps the figure inside a slide. Members draw themselves from end to end when they first appear, and layers fade in over half a second; both are off under prefers-reduced-motion, and :animate="false" turns them off for everyone. To slow them down for a lecture hall, see Restyling the animation.
In Slidev
Slidev makes slides from Markdown with Vue, so the component works there as it is. Install the libraries in the deck:
npm install @edubeam/plot @edubeam/fem
Put frame.ts and BuildUp.vue in the deck's components/ folder, and let the slide's clicks drive the step in slides.md:
---
clicks: 4
---

# From geometry to bending moment

<BuildUp :step="$clicks" />
clicks: 4 gives the slide four clicks, and $clicks counts them from 0. Each press of the arrow key shows the next stage; going back hides it again. slidev export makes a PDF of the deck, one page per click with --with-clicks.
In any Vue slides
Anywhere else, keep the step yourself:
<script setup lang="ts">
import { ref } from 'vue'
import BuildUp from './BuildUp.vue'

const step = ref(0)
</script>

<template>
  <BuildUp :step="step" />
  <button type="button" @click="step = Math.max(0, step - 1)">Back</button>
  <button type="button" @click="step++">Next</button>
</template>
Solve it live
The solver takes milliseconds for a frame like this, so a lecture can change the structure and solve it on the spot. Bind a load to a slider and pass a new solved model each time, as in When the model changes.
- A moving load. DiagramStack lets the students drag a point load along a beam and watch the shear force and bending moment follow it.
- Cases side by side. Fix
diagramScaleand two plots draw their moments at one scale, so the larger one looks larger. - Reading values. With
hover, pointing at a member marks the value at the tip of each diagram's ordinate: see Reading values.
Figures for Beamer, PowerPoint and Word
A deck made in LaTeX Beamer or PowerPoint, or notes written in Word, takes the figure as a file. structureSvg writes the plot as a standalone SVG with plain colours, laid out as StructurePlot lays it out. A Node script, frame-svg.ts, next to frame.ts:
import { writeFileSync } from 'node:fs'
import { modelFromSolver, structureSvg } from '@edubeam/plot'
import { portalFrame } from './frame.ts'

const frame = modelFromSolver(portalFrame())
writeFileSync('frame.svg', structureSvg(frame, { layers: ['members', 'supports', 'loads', 'reactions', 'M'] }))
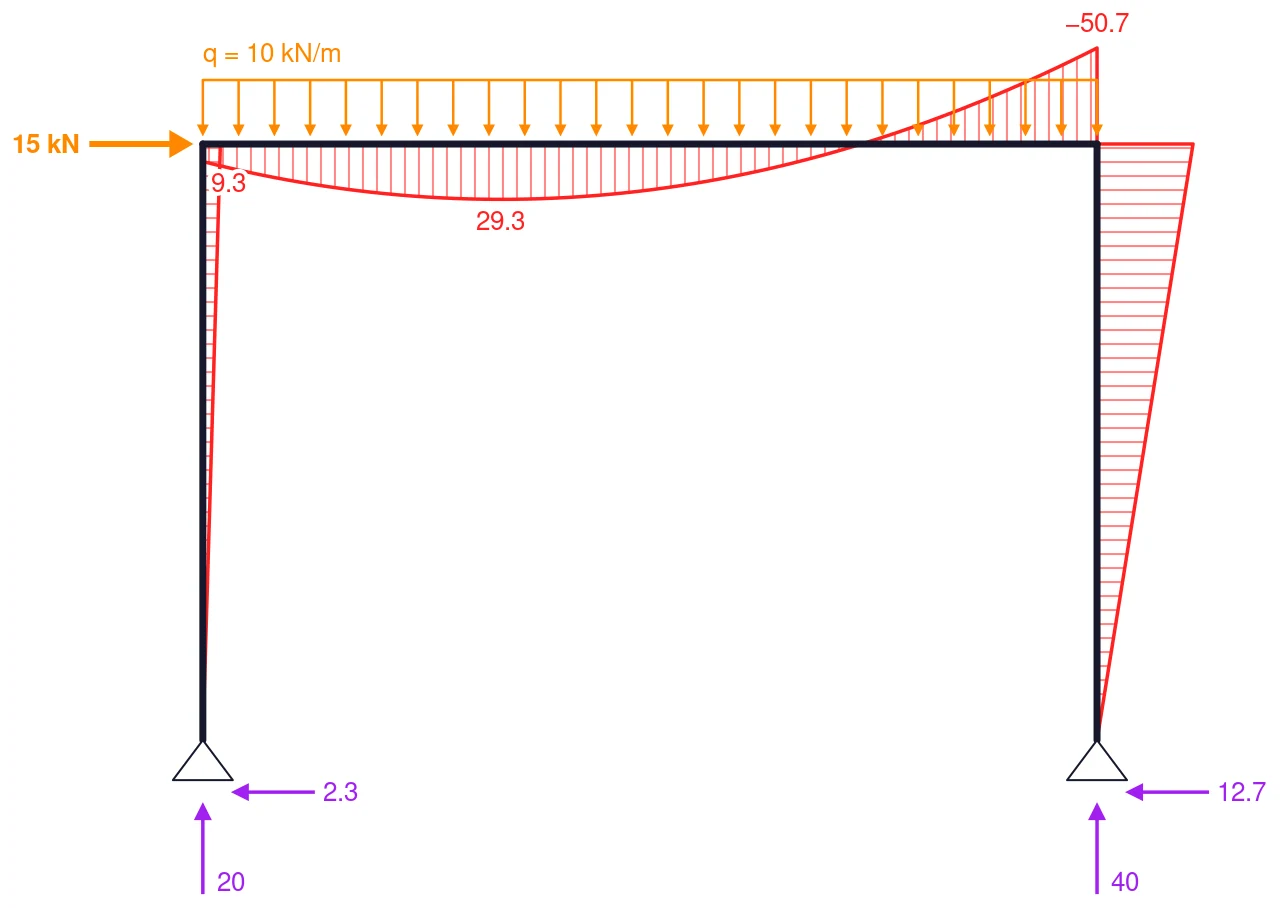
PowerPoint and Word (2019 and Microsoft 365) insert the SVG as it is. LaTeX takes it as PDF: convert it with cairosvg frame.svg -o frame.pdf or Inkscape, or let \includesvg from the svg package do it. Figures for LaTeX and Word has the details, and A standalone SVG file every option.
A build-up in Beamer
A file is fitted to the layers it draws, so files written for each stage on their own would not line up. Give structureSvg the same reserve as BuildUp.vue, every layer of every stage, and each file has the same size with the structure in the same place. frame-stages.ts writes one file per stage:
import { writeFileSync } from 'node:fs'
import { modelFromSolver, structureSvg, type PlotLayer } from '@edubeam/plot'
import { portalFrame } from './frame.ts'

const stages: PlotLayer[][] = [
  ['nodes', 'nodeLabels', 'dimensions'],
  ['nodeLabels', 'members', 'supports'],
  ['nodeLabels', 'members', 'supports', 'loads'],
  ['members', 'supports', 'loads', 'reactions'],
  ['members', 'supports', 'reactions', 'M'],
]
const all = [...new Set(stages.flat())]
const frame = modelFromSolver(portalFrame())

stages.forEach((layers, i) => {
  writeFileSync(`frame-${i + 1}.svg`, structureSvg(frame, { layers, reserve: all }))
})
Convert the files to PDF:
for i in 1 2 3 4 5; do cairosvg frame-$i.svg -o frame-$i.pdf; done
and give each its own overlay. Each file holds a whole stage, so the frame shows one at a time, and since they line up, each click seems to add a layer:
\begin{frame}{From geometry to bending moment}
  \centering
  \includegraphics<1>[width=0.8\linewidth]{frame-1.pdf}%
  \includegraphics<2>[width=0.8\linewidth]{frame-2.pdf}%
  \includegraphics<3>[width=0.8\linewidth]{frame-3.pdf}%
  \includegraphics<4>[width=0.8\linewidth]{frame-4.pdf}%
  \includegraphics<5>[width=0.8\linewidth]{frame-5.pdf}
\end{frame}
In PowerPoint, put the five files on five consecutive slides with no transition between them: each step looks the same as a click in the lecture.
Notes and handouts
- Course notes on the web. VitePress and Nuxt render plots at build time, so the figures are in the HTML before any script runs: see Embedding.
- Printed notes. Write the figures with
structureSvginto an HTML page and print it, as the test generator does, or include the files in LaTeX or Word. - One model, every figure. The same
frame.tsfeeds the slides, the notes and the exercise sheet, so they never disagree.