User Interface
Think of Edubeam as three simple zones that work together:
- App bar across the top for project actions.
- Viewer in the middle where you draw and inspect the model.
- Bottom bar with tabs for the details.
Once you know what lives in each zone, the app feels as easy as a whiteboard.
App bar
The app bar is your command center. From left to right you will find:
Project controls
- File – start fresh, open a JSON file, or restore an autosave. Share creates a link you can send to anyone.
- Units & settings – switch between metric/imperial, adjust autosave, and pick the background/grid style.
- Language – change the interface language on the fly.
Modeling tools
- Add nodes / elements – drop geometry directly from these buttons (they match the keyboard shortcuts shown in the tooltips).
- Load tools – quick buttons for point loads, distributed loads, settlements, temperature changes, and more.
- Undo / redo / history – step backward, forward, or open the history list if you want to explain what changed.
Results & exports
- Auto-solve toggle – keep it on for instant updates or pause it while you make a batch of edits.
- Display toggles – turn on/off reactions, diagrams, deformation shapes, coordinate axes, or background aids.
- Export – download JSON, SVG, or PNG snapshots, or copy tables straight to your clipboard.
Viewer
This is the canvas where you spend most of your time.
- Move around – scroll or pinch to zoom, hold space (or the middle mouse button) to pan. Double-click zooms to your selection.
- Select things – click a node or member, Shift-click to add more, or drag a box to select several at once.
- Right-click – opens a mini menu with edit/delete shortcuts so you don’t need to leave the canvas.
- Turn on helpers – grid, snap, and coordinate readouts live in the app bar so you can keep drawings tidy.
- Press
H– shows the keyboard shortcut palette whenever you need a reminder.
Bottom bar
All the structured data (numbers, labels, and presets) sit in tabs along the bottom. Work from left to right the first time; afterward you can jump between tabs as needed.
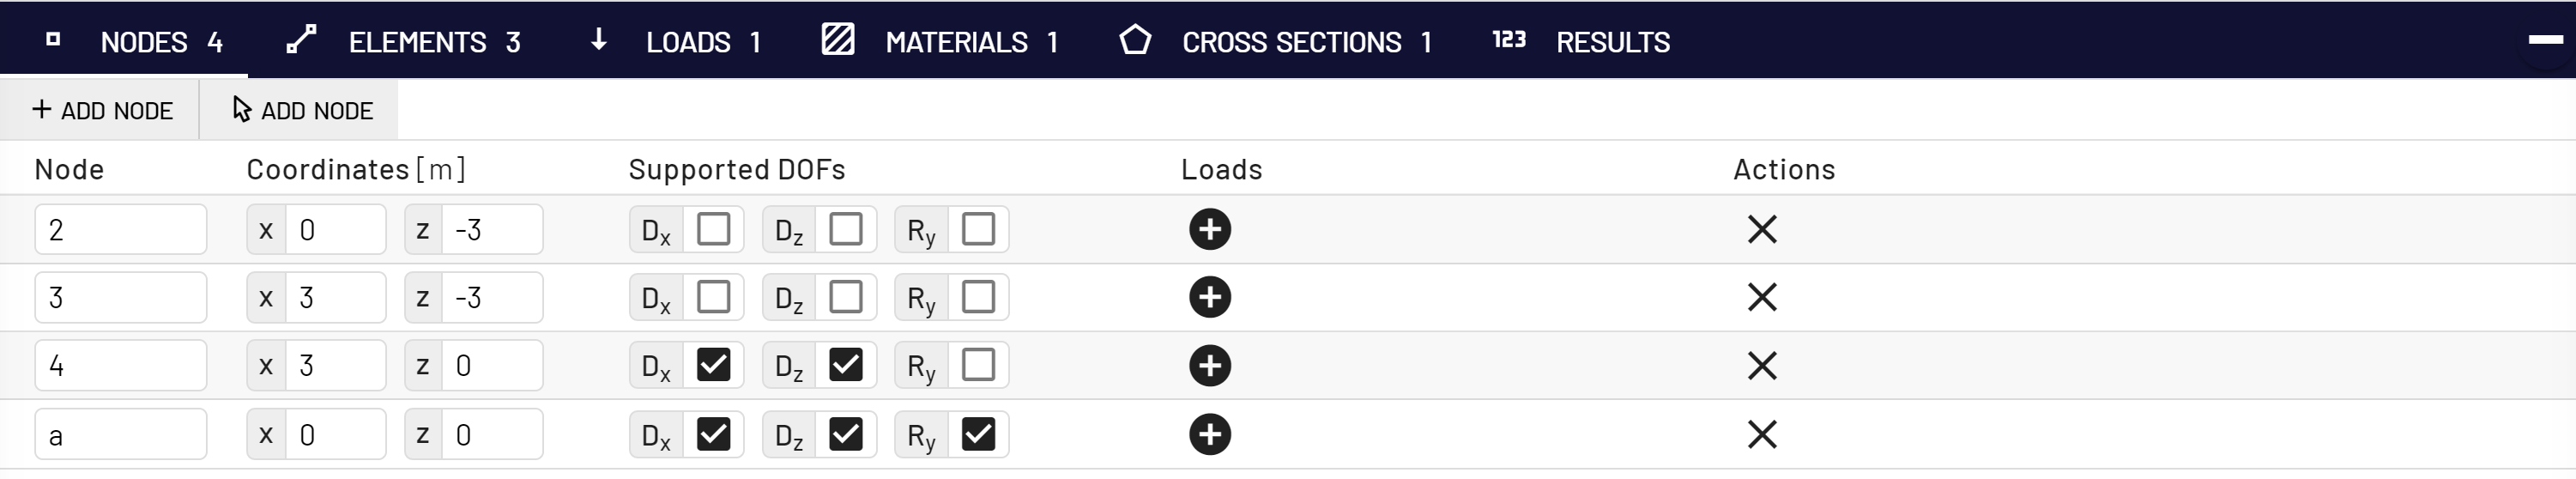
Nodes tab
- Enter coordinates, paste spreadsheets, or duplicate existing nodes.
- Lock positions when you don’t want a support to move.
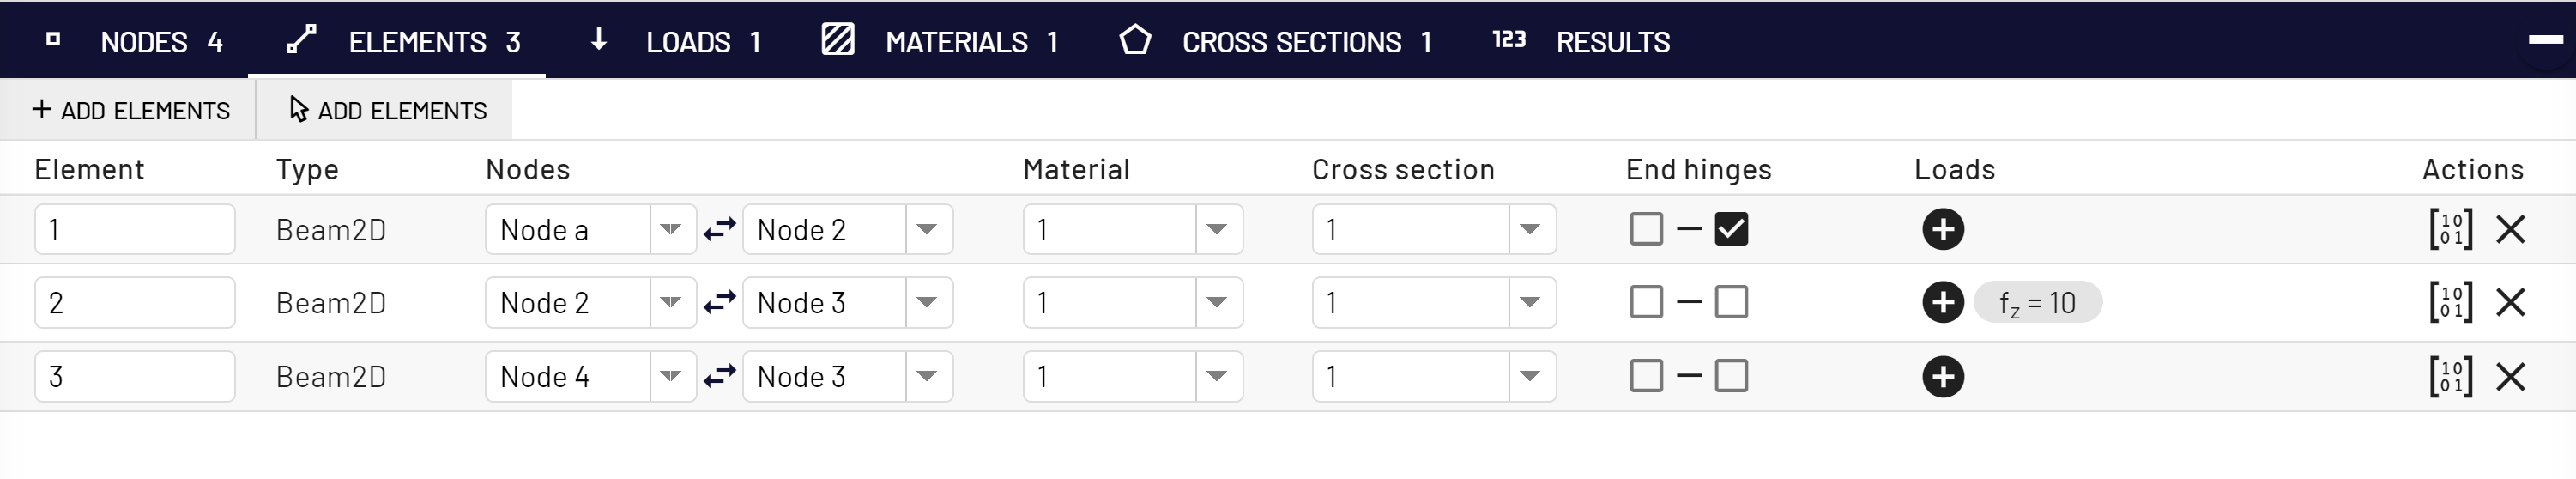
Elements tab
- Pick two nodes to create a member, then assign its material and section from the dropdowns.
- Use the toggles for hinges or releases when you need them.
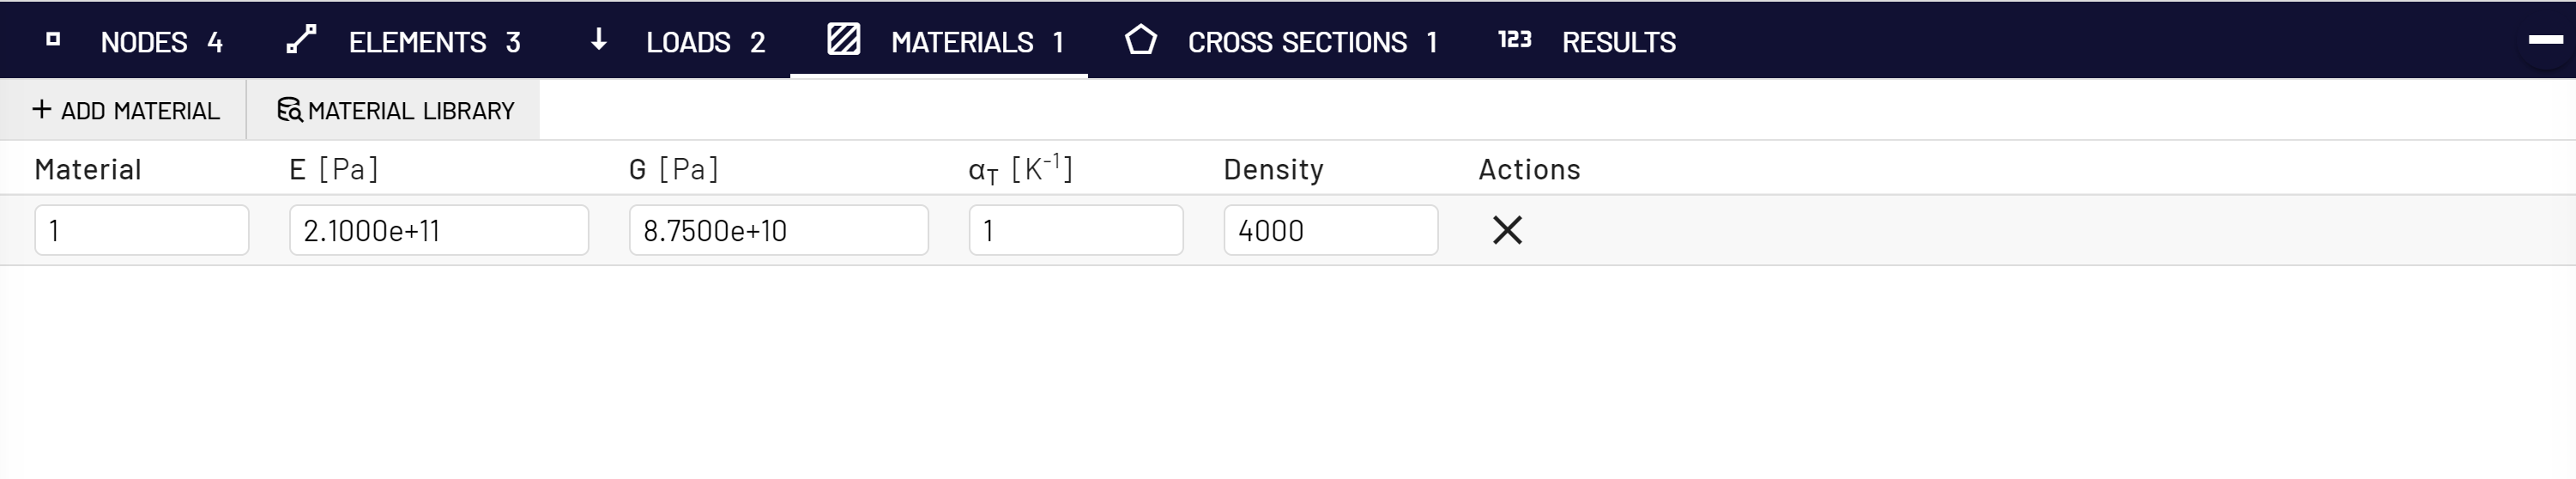
Materials tab
- Store the properties you use often (steel grade, timber class, concrete mix, etc.).
- Pin favorites so they stay at the top of the list.
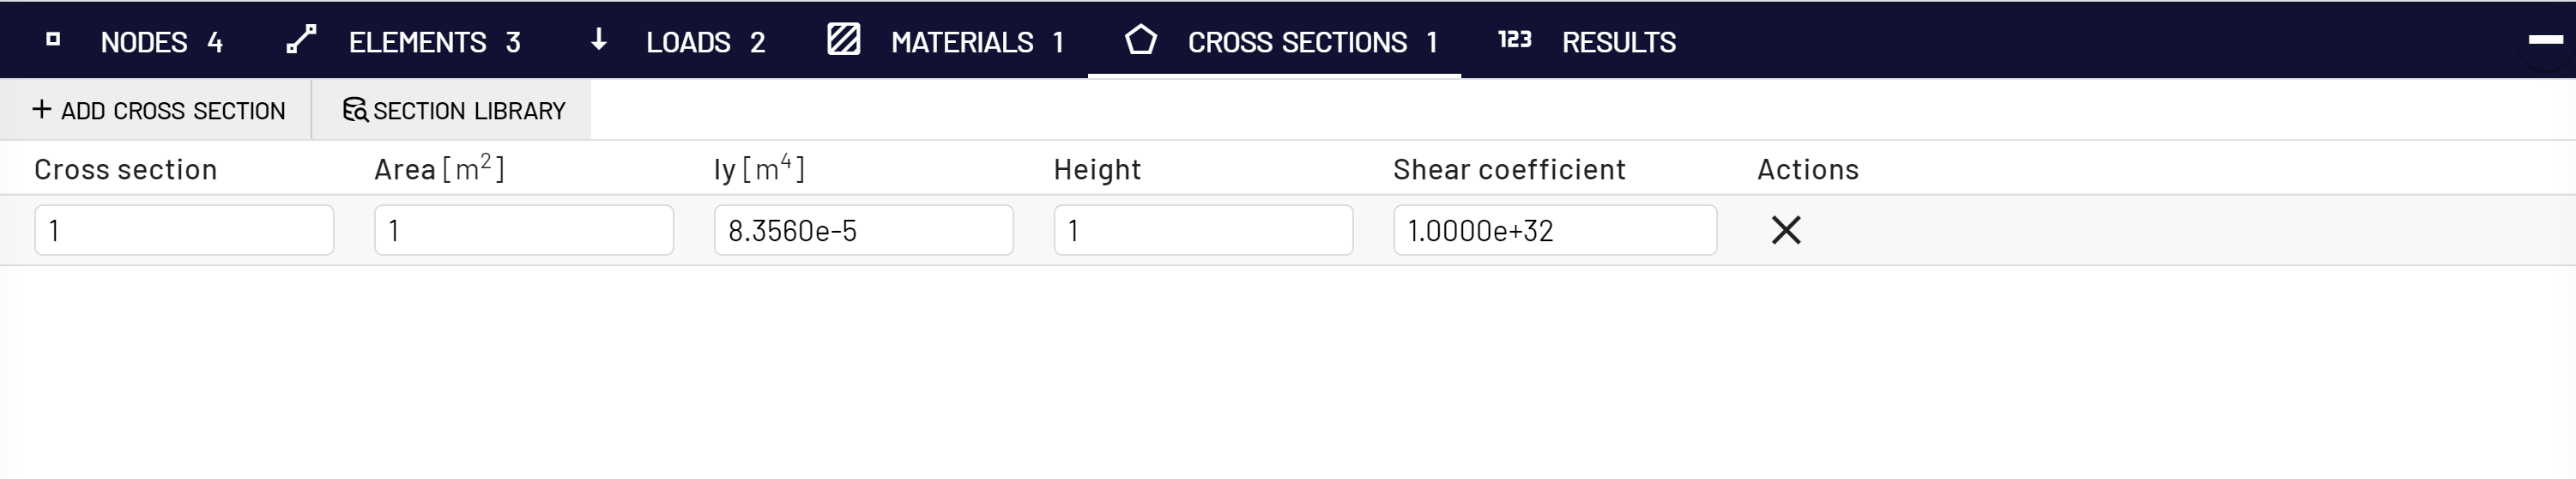
Cross sections tab
- Enter area and inertia values or use the built-in templates for quick shapes.
- Rename sections so you can spot them easily inside the element table.
Loads tab
- Apply nodal forces, moments, distributed loads, settlements, or temperature effects from one place.
- Group loads into cases to compare different scenarios (service vs. ultimate, demo A vs. demo B, etc.).
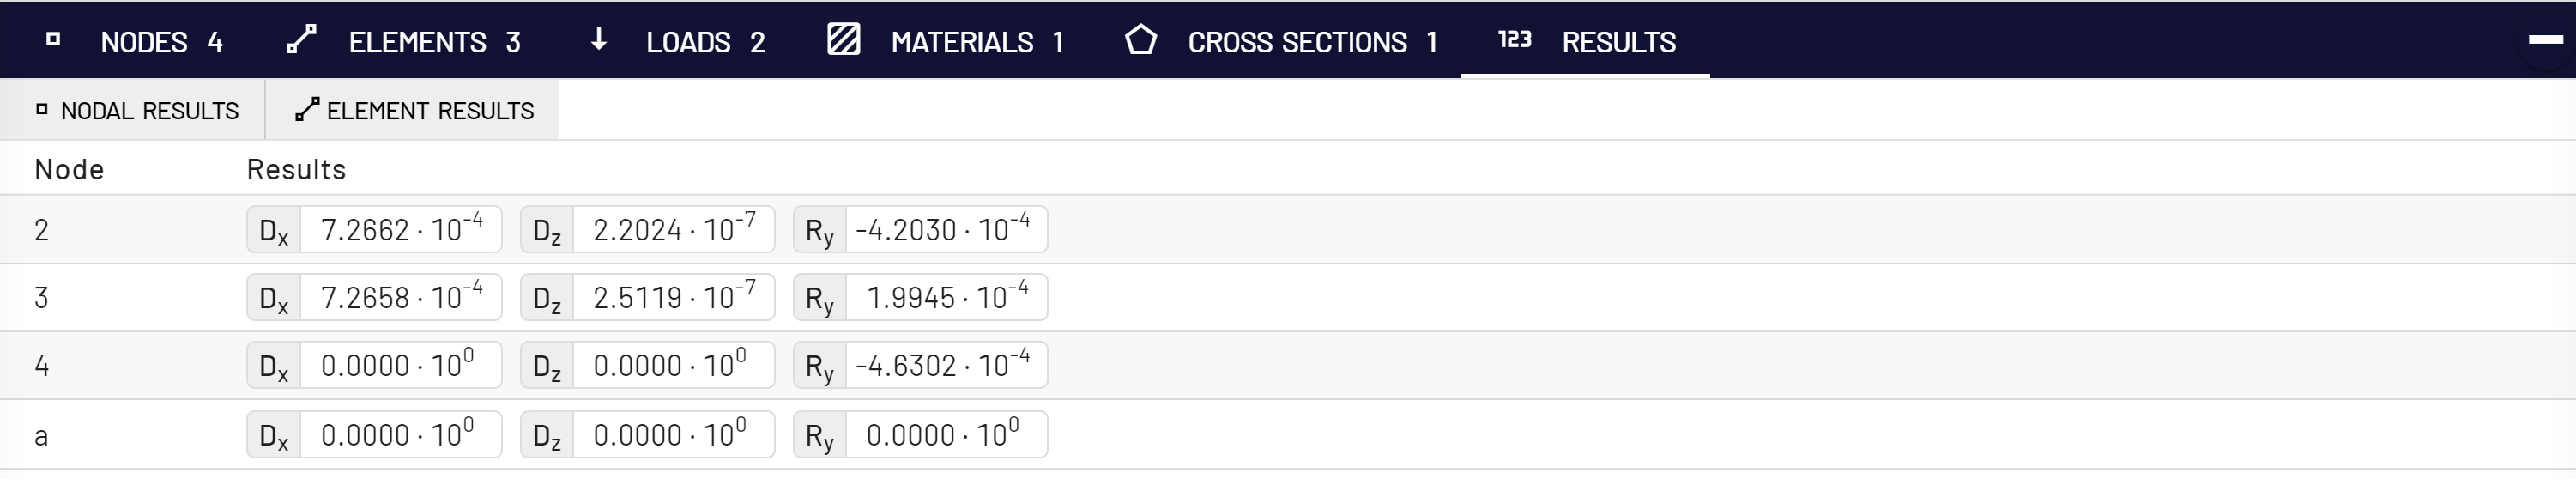
Results tab
- Read exact numbers for displacements, internal forces, and reactions.
- Highlight a row to see the matching member in the viewer and export CSV when you need a report.
Once you get the rhythm—App bar for actions, Viewer for visuals, Bottom bar for data—you can guide a class, review a homework submission, or test a design sketch without touching other software.